Getting Started
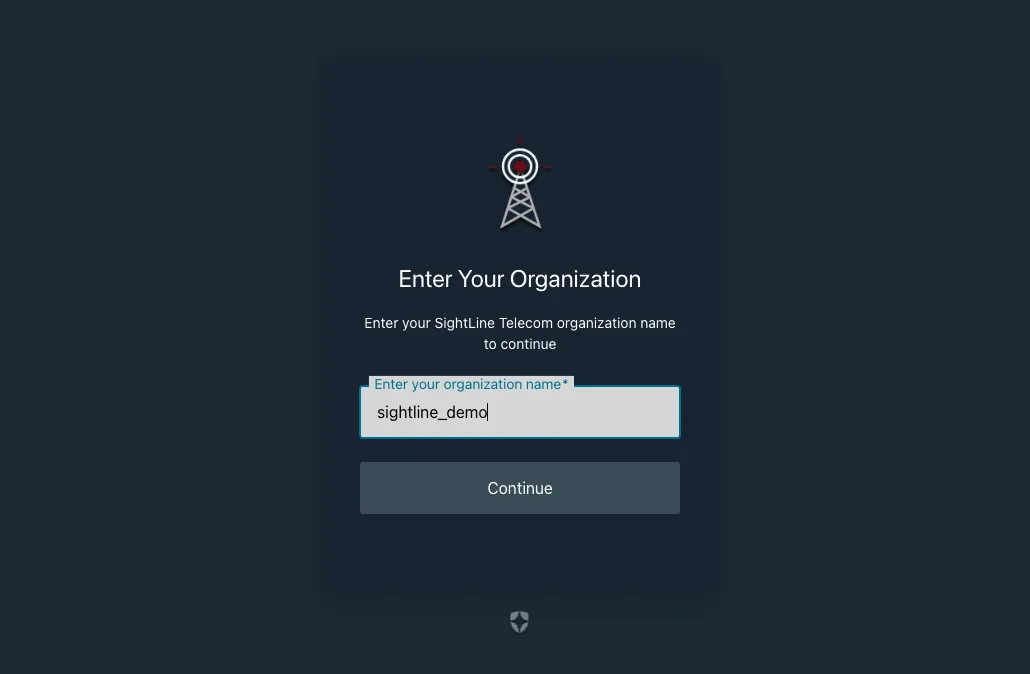
Logging In & Your Organization
Every account belongs to a single company workspace, and everything you see is scoped to your organization.
- Go to app.sightlinetelecom.com and log in.
- If your company hasn't been set up yet, create an account by checking out at sightlinetelecom.com/pricing and follow the steps in the confirmation email.
- If you were invited by your admin, use the link in your invite email and log in with the same email address it was sent to.
- If you did not receive the email, check your junk/spam inbox or ask your admin to reinvite you.
- Reach out to support@sightlinetelecom.com if any issues occur.
Configuring LOS Defaults
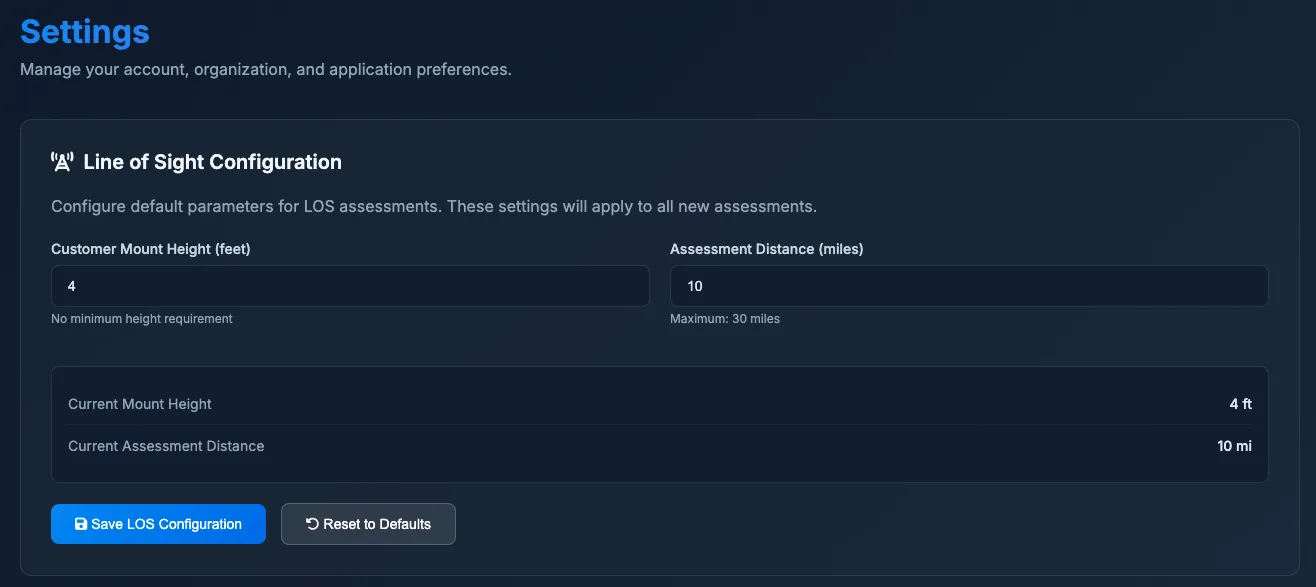
Before running assessments, set your organization's default assumptions under Settings → LOS Configuration. These defaults apply to every check unless overridden for a specific run.
- Customer Mount Height — the assumed antenna height at the client's location, in feet.
- Assessment Distance — the maximum search radius (in miles) SightLine will consider towers within.
Tip: These are starting points, not hard rules — you can adjust mount height or distance for an individual single check or bulk run without changing your org-wide defaults within the advanced controls panel.
Users & Roles
User Types & Permissions
Every user is assigned one of three roles, set when they're invited and adjustable later by an Admin.
| Capability |
Admin |
Super User |
User |
| Run LOS assessments |
✓ |
✓ |
✓ |
| Edit tower & access point database |
✓ |
✓ |
— |
| Manage users and permissions |
✓ |
— |
— |
| Access payment & billing |
✓ |
— |
— |
| Edit company settings |
✓ |
— |
— |
Inviting Team Members
Admins can invite new teammates from Settings → User Management.
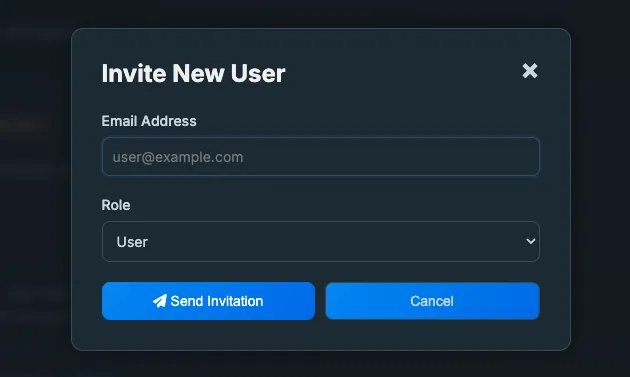
- Open Settings → User Management and click Invite.
- Enter their email address and choose their role (Admin, Super User, or User).
- They'll receive an email invite to create their login and join your organization.
- Pending invites and current team members are both listed on this tab — you can change a role or remove someone at any time.
Tower Data Management
Adding & Editing Towers
Your tower inventory lives in Data Management, available to Admins and Super Users for editing.
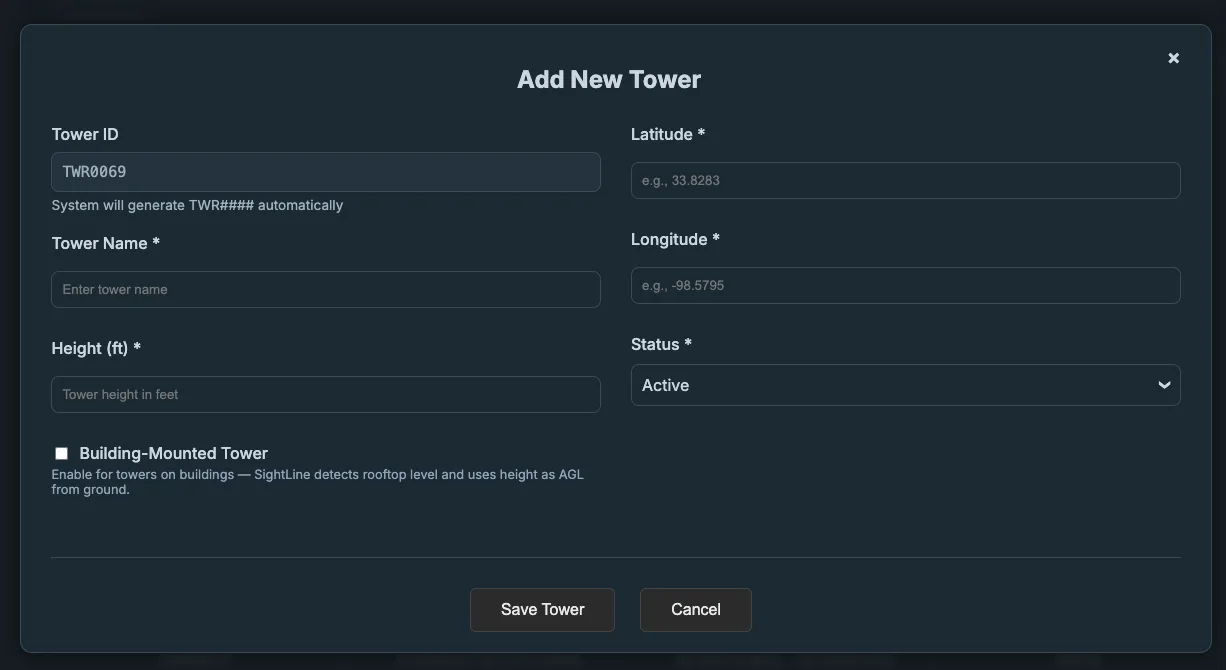
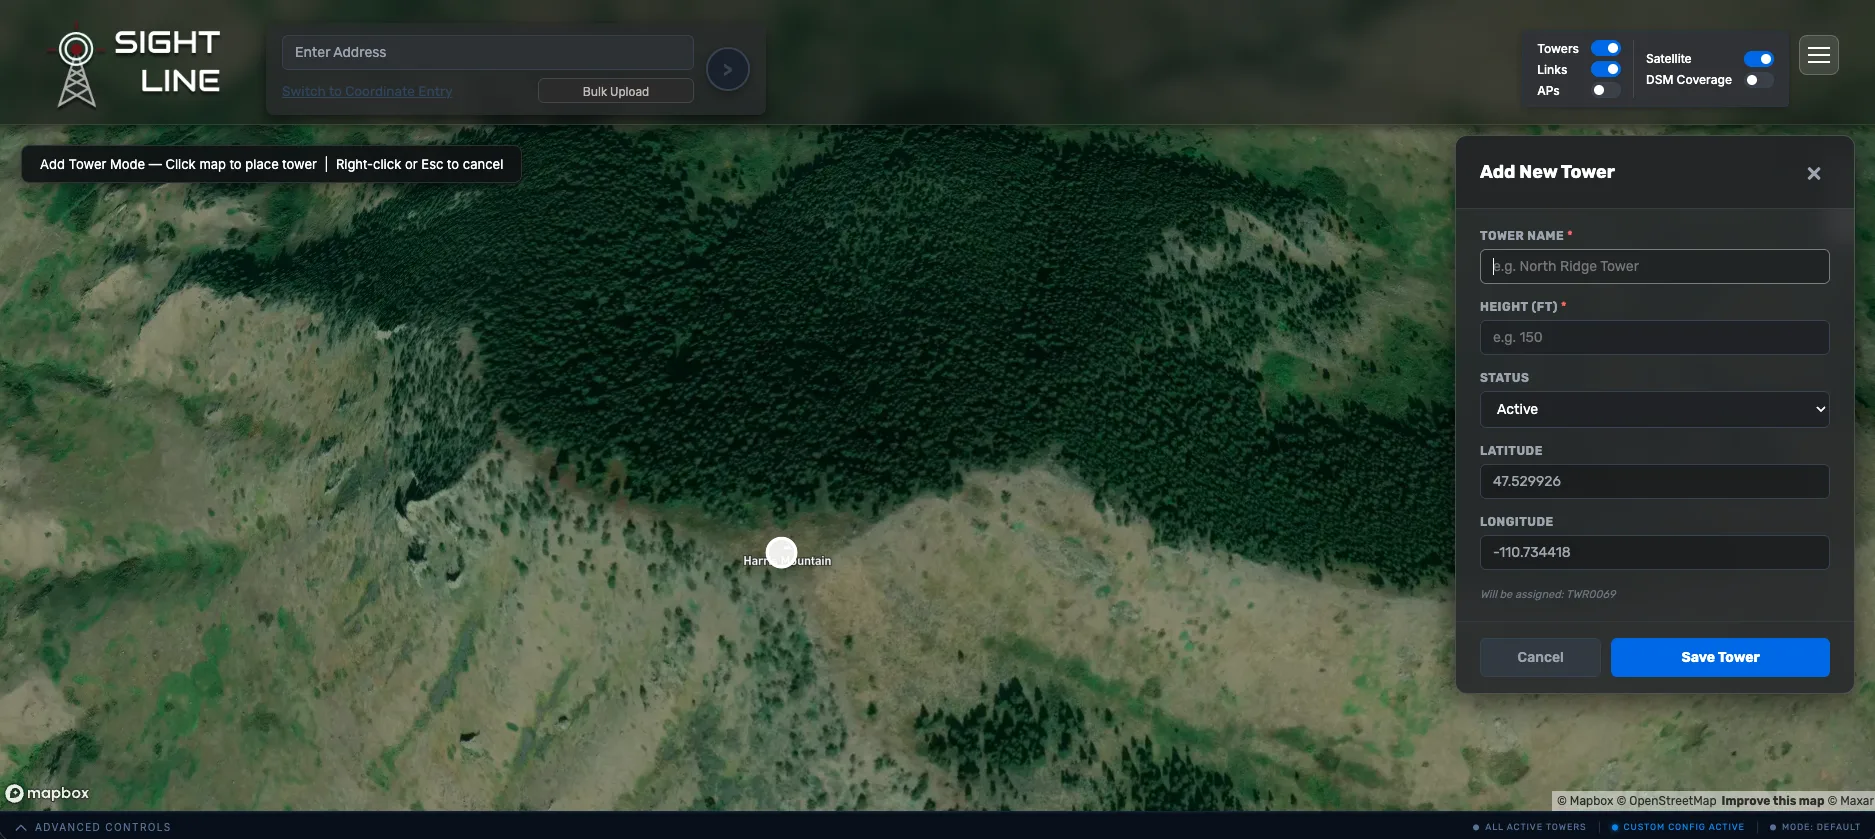
- Click Add Tower and enter the tower's name, mount height, and location — click directly on the map to set coordinates.
- Mark a tower as building-mounted if it sits on a rooftop rather than a freestanding structure; SightLine accounts for this when estimating ground elevation beneath it.
- Select any tower to edit its details, view its access points, or remove it.
Adding a Tower from the LOS Check Map
You don't have to leave the LOS Check page to add a tower — the Advanced Controls drawer has its own Add Tower shortcut that opens the same flow directly on the map you're already working in.
- Expand Advanced Controls at the bottom of the LOS Check page and click Add Tower.
- Click anywhere on the map to drop the new tower at that location — no need to type coordinates by hand.
- Fill in the name, mount height, and any other details, then save. The tower is added to your inventory immediately and is available for that run and every future check.
Access Points & Speed Bands
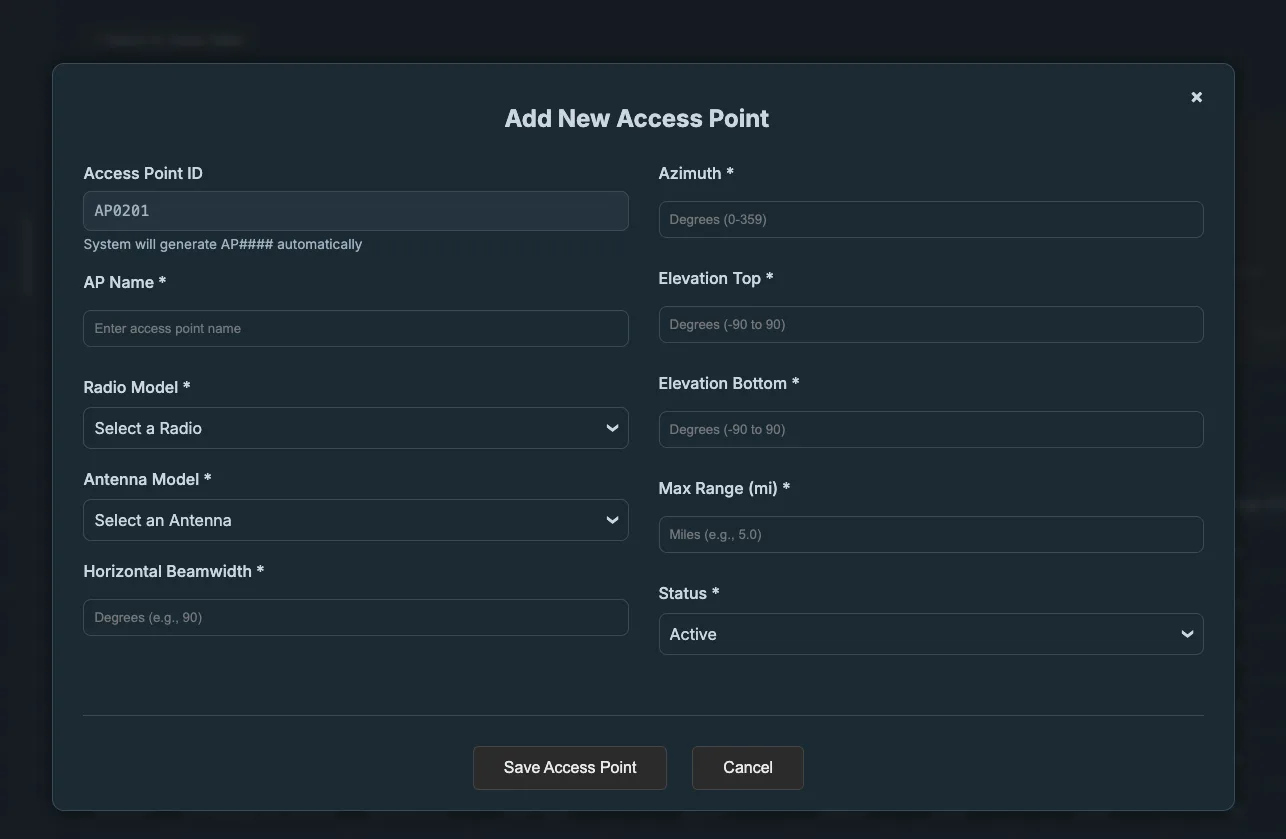
Each tower can have one or more access points (APs). Select a tower to see its APs, then add, edit, or remove them from there.
- Set azimuth, beamwidth, and elevation tilt so SightLine can determine whether a customer falls inside an AP's coverage sector.
- SightLine is vendor-agnostic — APs from any manufacturer (Ubiquiti, Cambium, Mimosa, etc.) can be modeled side by side.
How Speed Bands Work
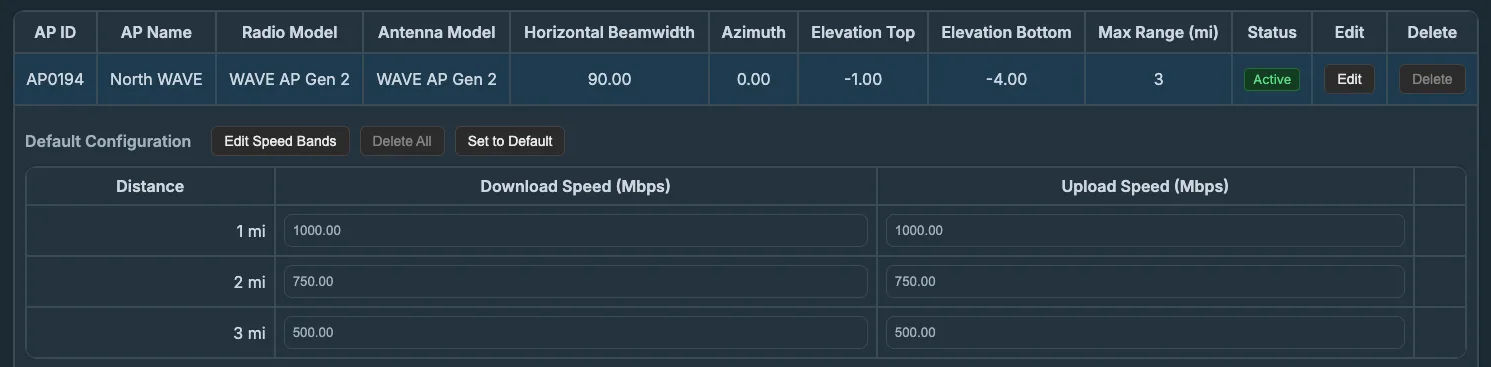
Speed Bands are what let SightLine estimate a customer's actual download/upload speed, not just a yes/no on coverage. On any access point, open Speed Bands and set an expected download and upload speed (Mbps) for each mile of distance out to that AP's max range.
- Distance is bucketed in whole miles — e.g. 1 mi, 2 mi, 3 mi — each with its own download/upload figures, since real-world throughput drops off with distance for most fixed-wireless gear.
- When a customer is evaluated against that AP, SightLine looks up the band matching their distance and reports the expected speed alongside the serviceability result.
- Set these based on your own field data or equipment specs — they're specific to each AP, so two APs using the same radio model at different sites can still have different speed bands if real-world performance differs.
- Default Speed Bands — every radio/antenna pairing also gets its own default speed band profile, configurable from Equipment Models. Set it up once, then apply it to an individual AP with Set to Default, or push it to every AP for that pairing at once with Apply Default to All.
Speed bands directly drive result
prioritization — when a customer has multiple viable towers, SightLine recommends the one with the best expected speed at that distance, not just the nearest one.
Network Links
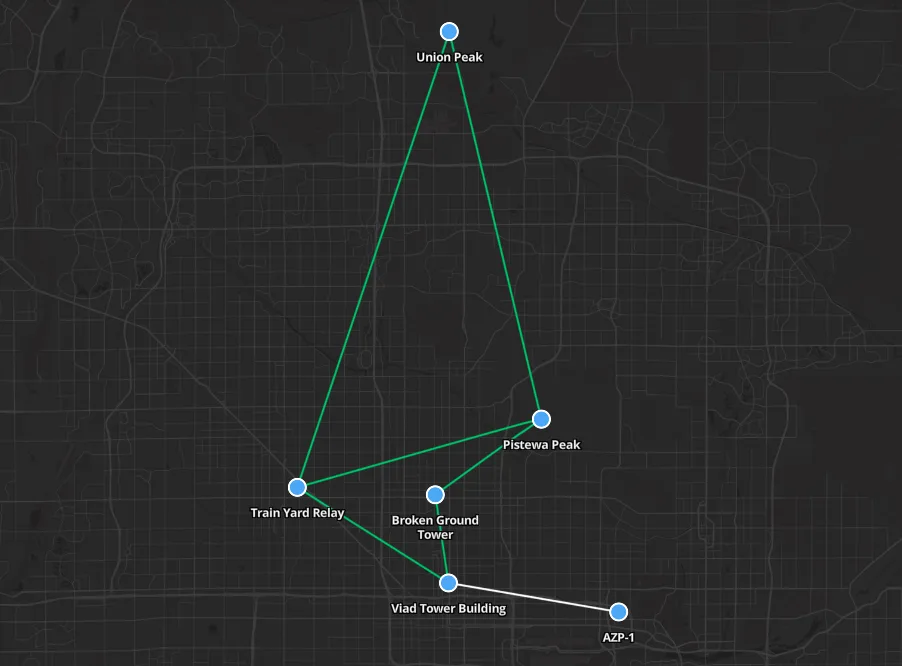
Select a tower and open Network Links to add or review them.
- Link two towers together and record the connection type (e.g. wireless or fiber), along with the status.
- Links display on the map alongside your towers and access points, giving you a full picture of your backhaul topology.
- Like towers and APs, network links can be bulk-imported via CSV — see Bulk Importing via CSV.
Equipment Models Library
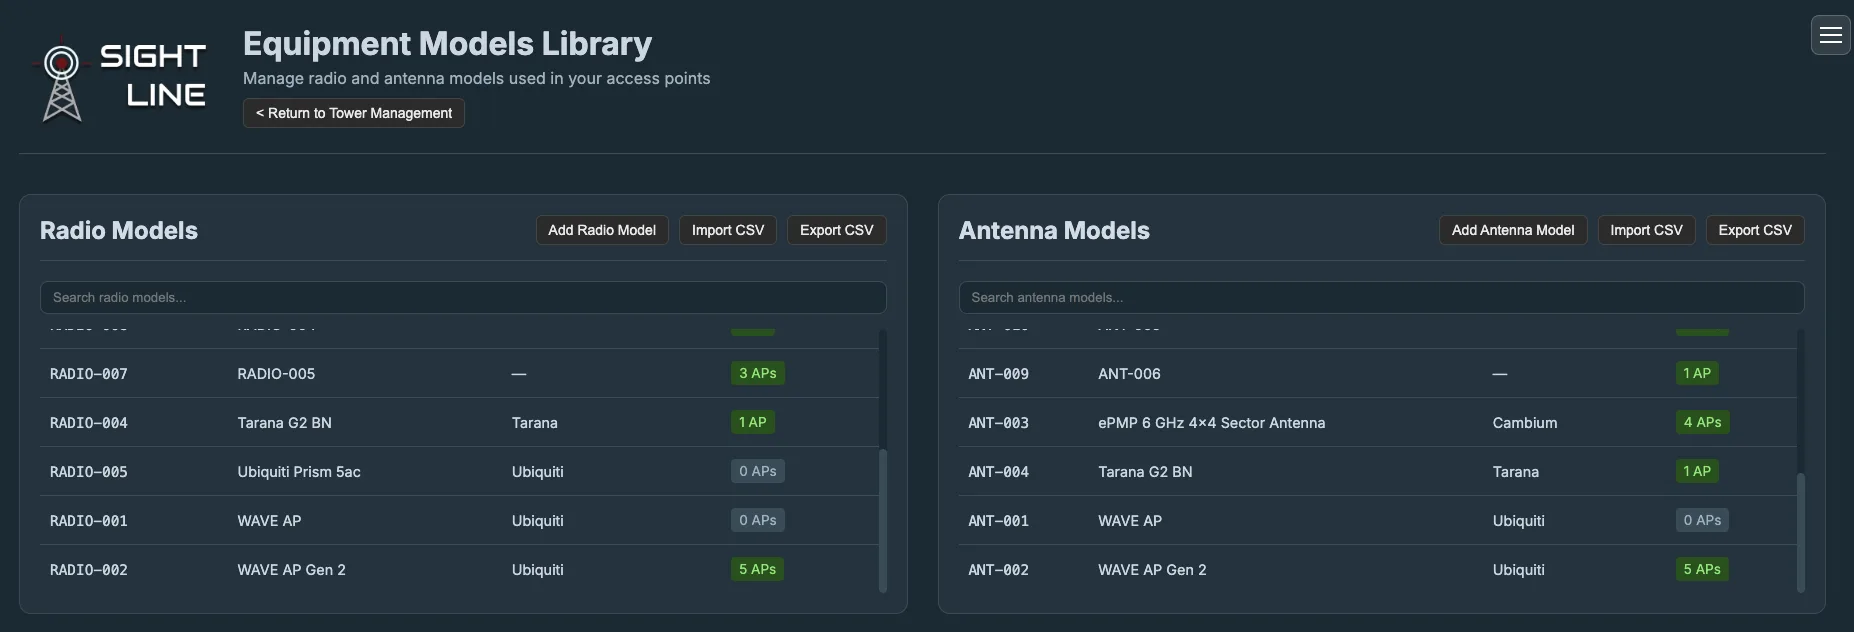
The Equipment Models Library is where you maintain a reusable catalog of radio and antenna model names — so when you add an access point, you pick from a saved model instead of retyping the same manufacturer and model name every time. The library itself just tracks the name and manufacturer; it doesn't store specs or range for the model.
- Every radio + antenna pairing you actually put on an AP shows up under Radio / Antenna Pairs here — and that pairing is the basis for a default speed band profile, where the range and per-mile speed figures live.
Bulk Importing via CSV
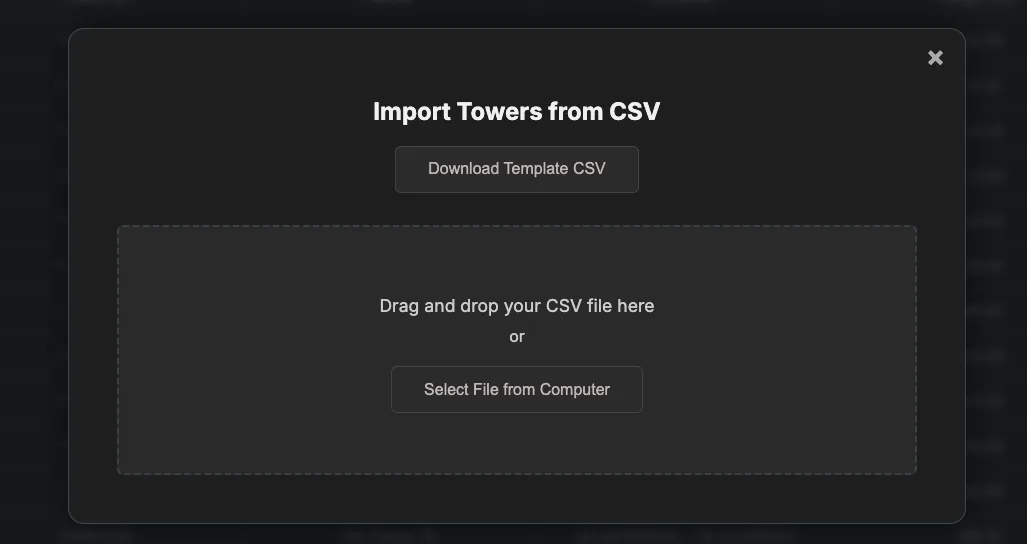
Towers, access points, and network links can all be imported in bulk instead of entered one at a time.
- From Data Management, choose Import from CSV for towers, access points, or network links.
- Click Download Template CSV to get the exact column format SightLine expects.
- Fill in the template and upload it.
- If any rows fail validation, you can download an error report describing exactly which rows to fix and why.
| Import Type |
Required Headers |
| Towers |
tower_name, lat, lon, height_ft, status
is_building_mounted is optional and defaults to false if omitted. |
| Access Points |
tower_id, ap_name, radio_model, antenna_model, horizontal_beamwidth, azimuth_centerline, elevation_top, elevation_bottom, max_range_miles, status
band_1_down/band_1_up through band_30_down/band_30_up are optional — leave max_range_miles and every band column blank on a row to inherit that radio/antenna pairing's default speed bands instead. |
| Network Links |
tower_a_id, tower_b_id, link_type, status
link_type must be wireless_backhaul or fiber. |
For all three, status must be one of Active, Planned, or Decommissioned.
Running LOS Checks
Single Address Check
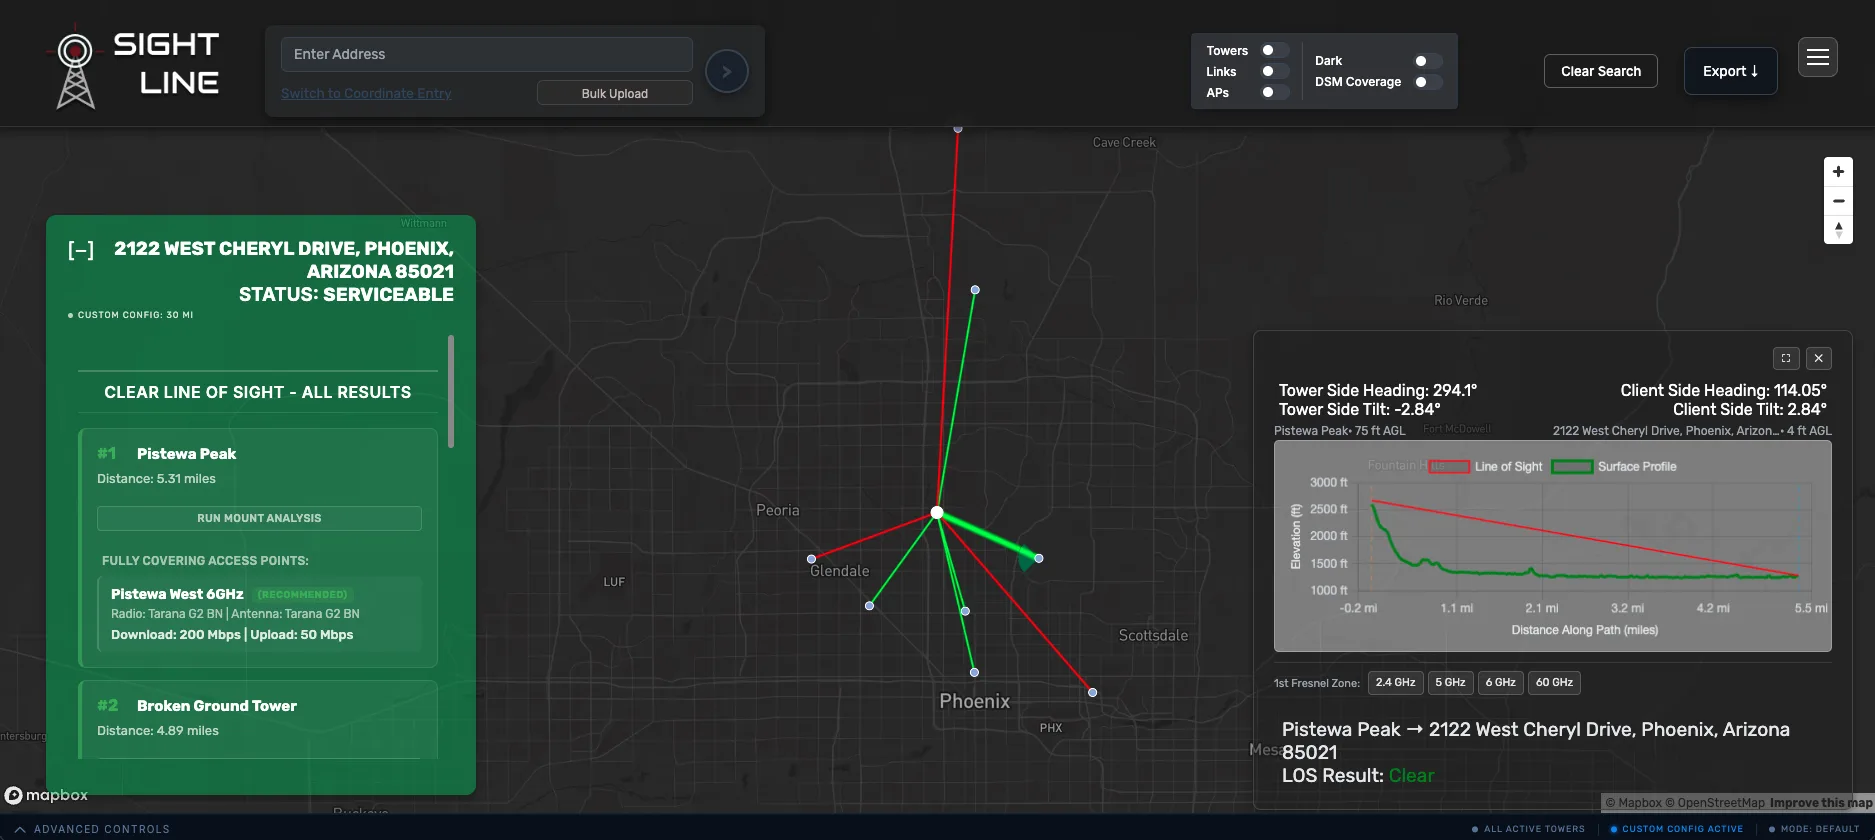
Qualify a location for service by checking line-of-sight and AP availability to any tower in your network.
- From the LOS Check page, enter an address or drop a pin by latitude/longitude.
- SightLine searches every tower within your Assessment Distance and evaluates surface elevation — including buildings and trees, not just bare ground — and each access point's coverage sector.
- Results come back in seconds, with a serviceability status per tower and a visual elevation profile explaining why a path is clear or obstructed and a prioritized list of towers based on line-of-sight, AP availability, and distance.
Bulk Address Check
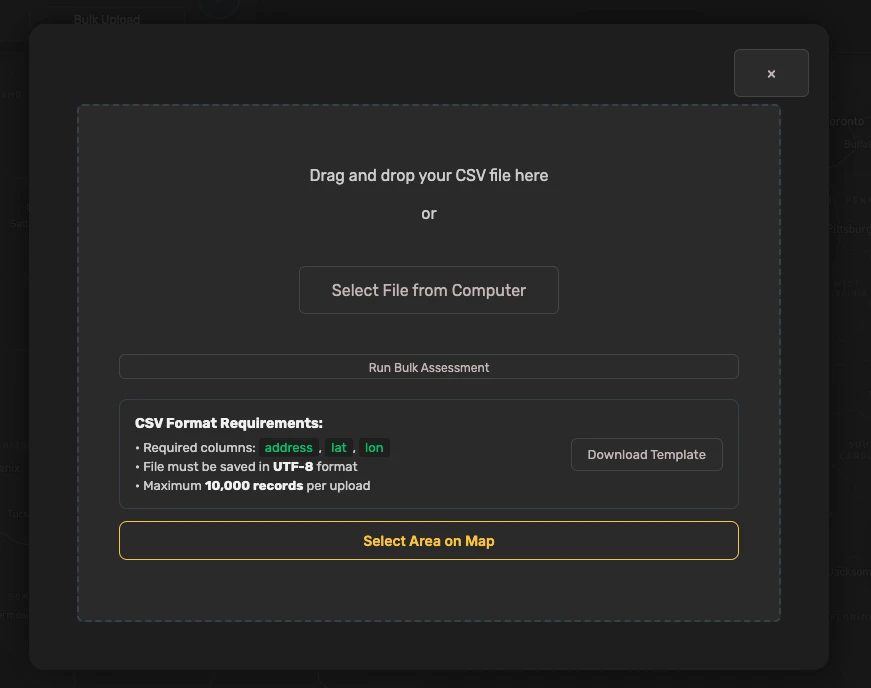
Have a list of leads or an entire campaign's worth of addresses? Use Bulk Upload on the LOS Check page to qualify many addresses at once instead of one by one.
- Click Bulk Upload and choose to upload by address or by lat/lon coordinates.
- Upload your CSV, name the project, and click Run Bulk Assessment.
- Track progress from the Bulk Assessment Job Queue, and review results as they complete.
Required headers: address, lat, lon. All three columns must be present, and every row needs a numeric lat/lon — SightLine doesn't geocode addresses for bulk jobs, so address is carried through as a label on your results rather than looked up. Download the template CSV from the upload modal to get the exact format.
Bulk upload is available on the SightLine Pro plan. See
pricing for details.
Bulk Area Select
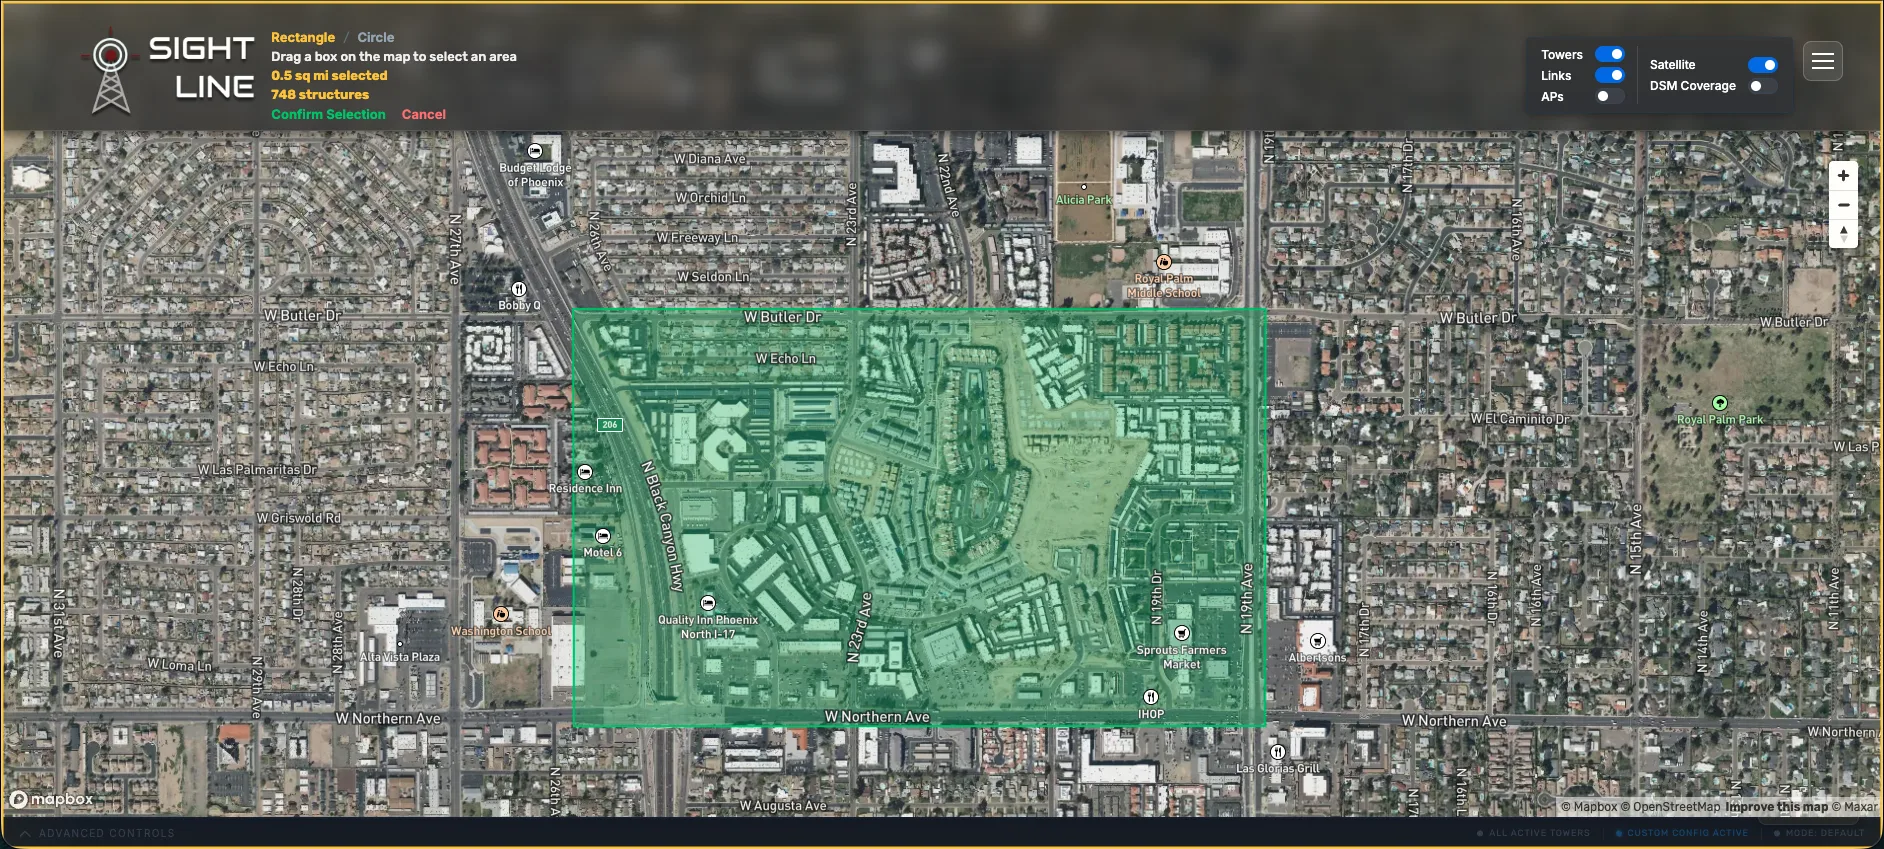
You can run a bulk check directly against real structures on the map instead. From the Bulk Upload panel, choose Select Area on Map.
- Draw a rectangle or circle over the region you want to qualify. Switch shapes with the Rectangle / Circle toggle before you start drawing.
- SightLine pulls every known structure inside that shape from the National Structure Inventory (NSI) and shows you a live count as you adjust the shape.
- Click Confirm Selection, name the project, and run it — same as a CSV-based bulk job from here on, tracked in the Bulk Assessment Job Queue.
Area-select results include an extra breakdown by structure/service type crossed with serviceability status, useful for understanding coverage across a neighborhood or region at a glance.
Using this method, you can export the latitude and longitude of every location for further analysis and reverse geocoding.
Bulk Area Select uses the same NSI dataset described under
Structure Data — it's how SightLine knows what's inside your drawn shape without you supplying a list yourself.
Advanced Controls
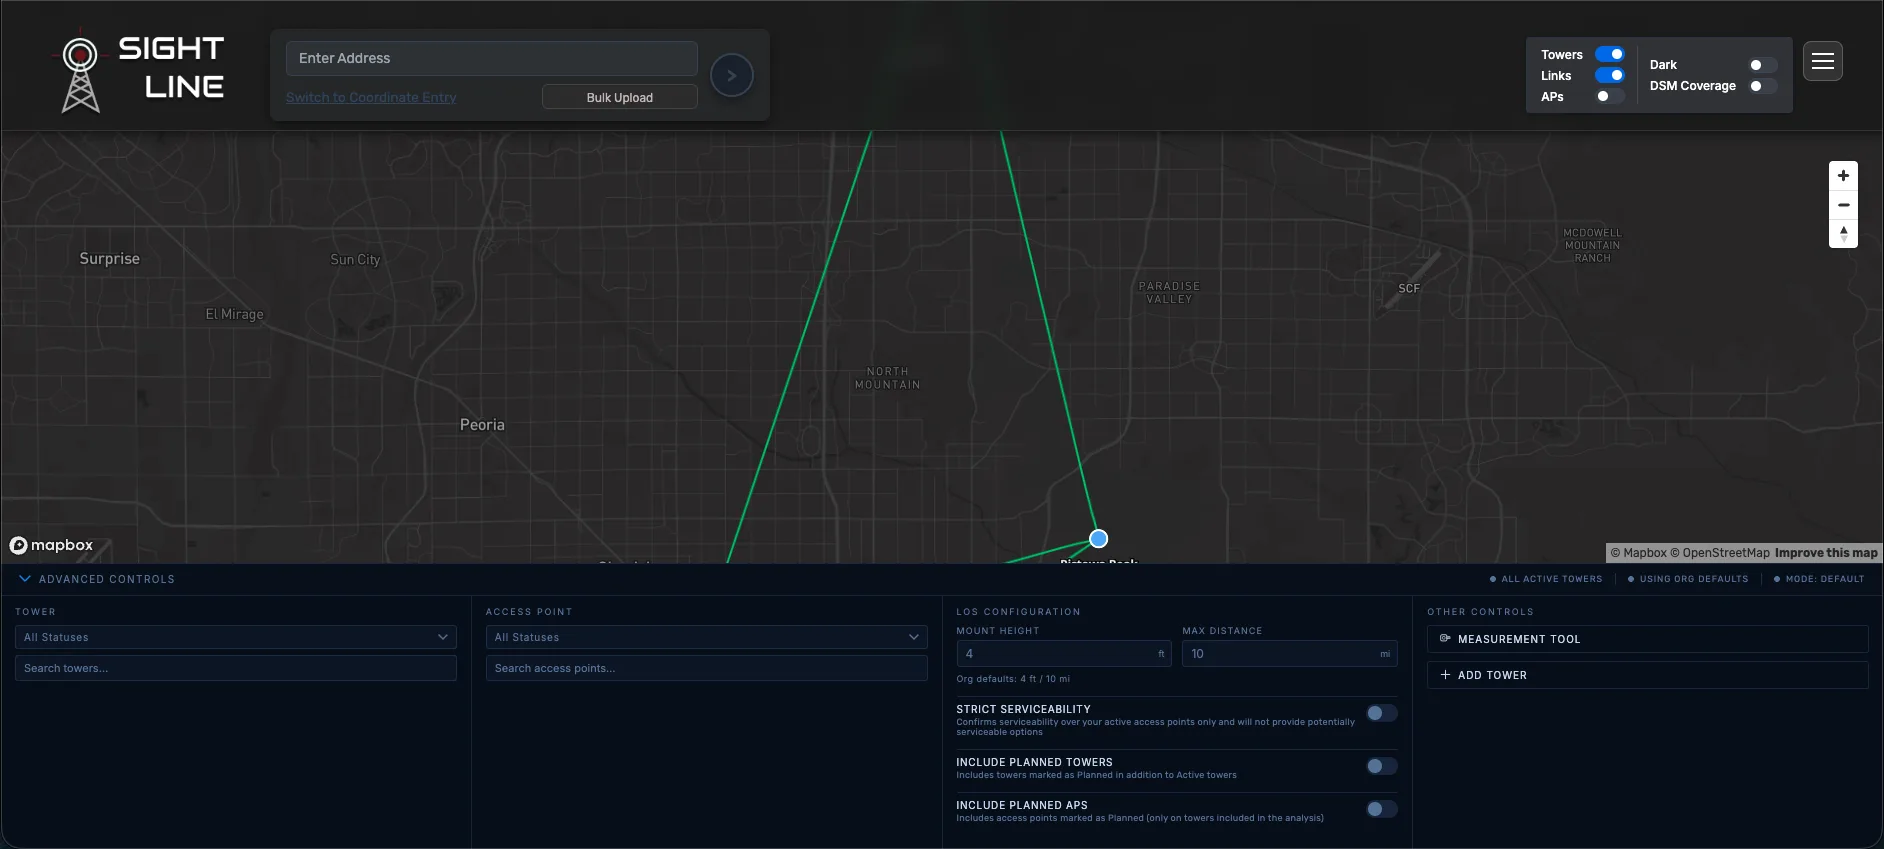
Need to fine-tune a specific run without changing your org-wide defaults? Click the Advanced Controls strip at the bottom of the LOS Check page to expand it. Your org defaults are not overwritten by it.
The collapsed strip always shows a quick summary of what's active — which towers are in scope, whether you're using org defaults or an override, and the current mode — so you can tell at a glance if a run isn't using standard settings.
Filtering by Tower & Access Point
By default every active tower and AP is considered within your max range configuration. Narrow that down when you only care about a subset of your network:
- Filter the Tower list by status, or search and select specific towers by name.
- Filter the Access Point list the same way — if you've already selected specific towers, the AP list scopes to just those towers' APs.
Per-Run LOS Configuration
Override Mount Height (ft) or Max Distance (mi) for just this run — useful for testing a taller customer mount or a wider search radius without touching your org's saved defaults under LOS Configuration.
Strict Serviceability & Planned Infrastructure
- Strict Serviceability — confirms serviceability over your active access points only and will not provide potentially serviceable options.
- Include Planned Towers — includes towers marked as Planned in addition to Active towers.
- Include Planned APs — includes access points marked as Planned (only on towers already included in the analysis).
Other Controls
- Measurement Tool — measure distances directly on the map.
- Add Tower — a shortcut into the same Add Tower flow, without leaving the LOS Check page.
Reading Your Results
Every checked address is classified into one of the following statuses:
- Serviceable — clear line-of-sight to at least one tower with a covering access point.
- Potentially Serviceable — a path exists but falls outside strict coverage criteria; worth a closer look before committing.
- Not Serviceable — no clear line-of-sight to any tower in range.
- Out of Range — no towers found within your configured Assessment Distance.
- No DEM Data — elevation data isn't available for that location, so LOS couldn't be evaluated. If this occurs, reach out to support@sightlinetelecom.com to see if additional surface coverage can be added.
How Results Are Prioritized in the Results Card
When more than one tower can potentially serve a customer, SightLine ranks them so the best option is always listed first — not just the closest one. The order follows four tiers:
- Fully covering towers — the customer falls inside an access point's azimuth and elevation coverage. Within this tier, towers are sorted by fastest download speed first, then fastest upload speed as a tiebreaker, then shortest distance.
- Potentially covering towers — the customer falls inside an AP's azimuth but the elevation/tilt fit is less certain. Sorted the same way: download speed, then upload speed, then distance.
- Towers with no AP coverage — line-of-sight is clear but no access point's sector actually reaches the customer. Sorted by distance only, since there's no speed estimate to rank by.
- Obstructed towers — no clear line-of-sight to the tower at all. Also sorted by distance only, and ranked below every other tier since there's no viable path.
Expected speeds come from each access point's Speed Bands.
CSV & KMZ Exports
Every result screen offers a CSV and a KMZ export option — but what's inside depends on whether you're looking at a single check, one address inside a bulk job, or the full bulk job overview.
| Assessment Type |
CSV Export |
KMZ Export |
| Single Address Check |
One row per tower × access point checked for that address, with LOS status, serviceable status, and speed band per AP. |
Full multi-layer file — clients, towers, links, and viable access point sectors, all viewable together in Google Earth. |
| Bulk Check — Individual Address |
Same per-tower/per-AP detail as a single check, scoped to just that one address. |
Same multi-layer file as a single check, scoped to just that one address. |
| Bulk Check — Job Overview |
One file covering every address in the job — a row per address × tower × access point, so you can filter and pivot the entire job in Excel or GIS without opening each address individually. |
One placemark per address, color-coded by serviceable status (green / blue / red), for a quick visual scan of the whole job in Google Earth. |
Bulk overview CSV columns: each row carries two separate status fields — los_status (Clear / Obstructed / Insufficient Data — the raw line-of-sight result for that tower) and serviceable_status (Serviceable / Potentially Serviceable / Obstructed / Insufficient Data — factoring in whether an access point actually covers that direction). Filter on whichever one matters for what you're doing: los_status for the raw surface/obstruction result, serviceable_status for a sales- or planning-ready read.
Mount Analysis
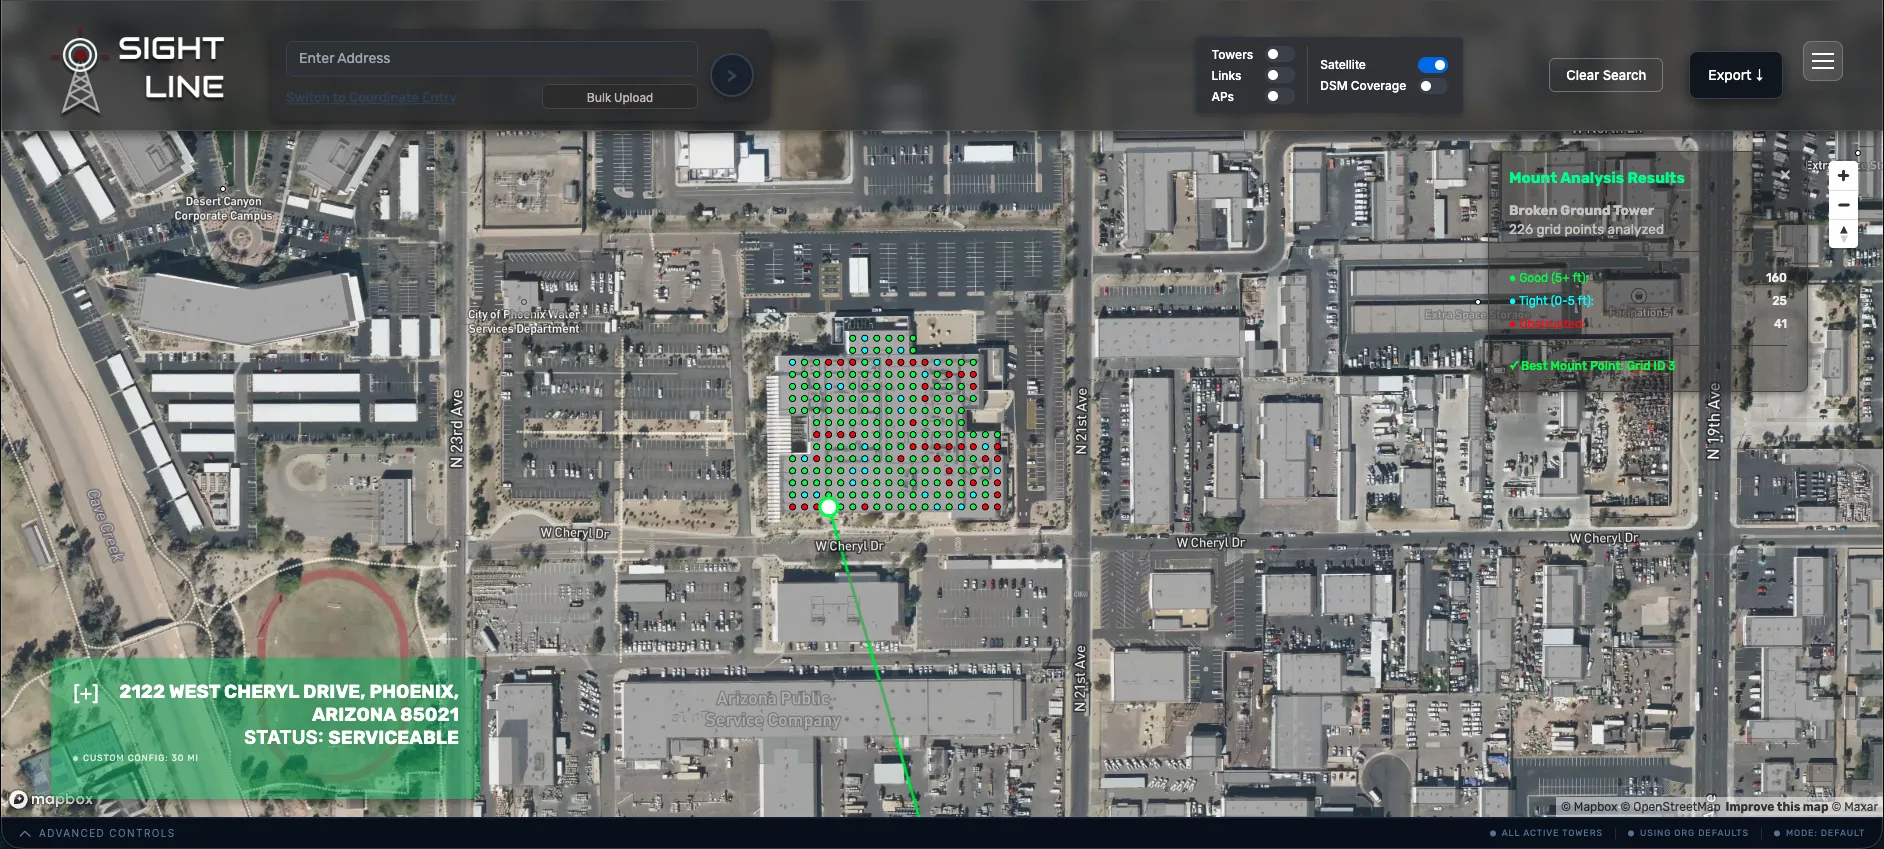
An assessment tells you whether a customer's location has line-of-sight at a point on the roof — Mount Analysis tells you exactly where on their roof to place equipment. From any tower's result card on an individual assessment, click Run Mount Analysis.
- SightLine locates the building footprint at the customer's location automatically and lays a grid of candidate mount points across the rooftop.
- Each point is evaluated for line-of-sight to the selected tower and color-scored:
- Green — clear line-of-sight with a healthy clearance margin (5+ ft).
- Blue — clear, but tight — under 5 ft of clearance, worth double-checking in the field.
- Red — obstructed at that specific mount point.
The Mount Analysis feature may not be available for every location.
Viewshed
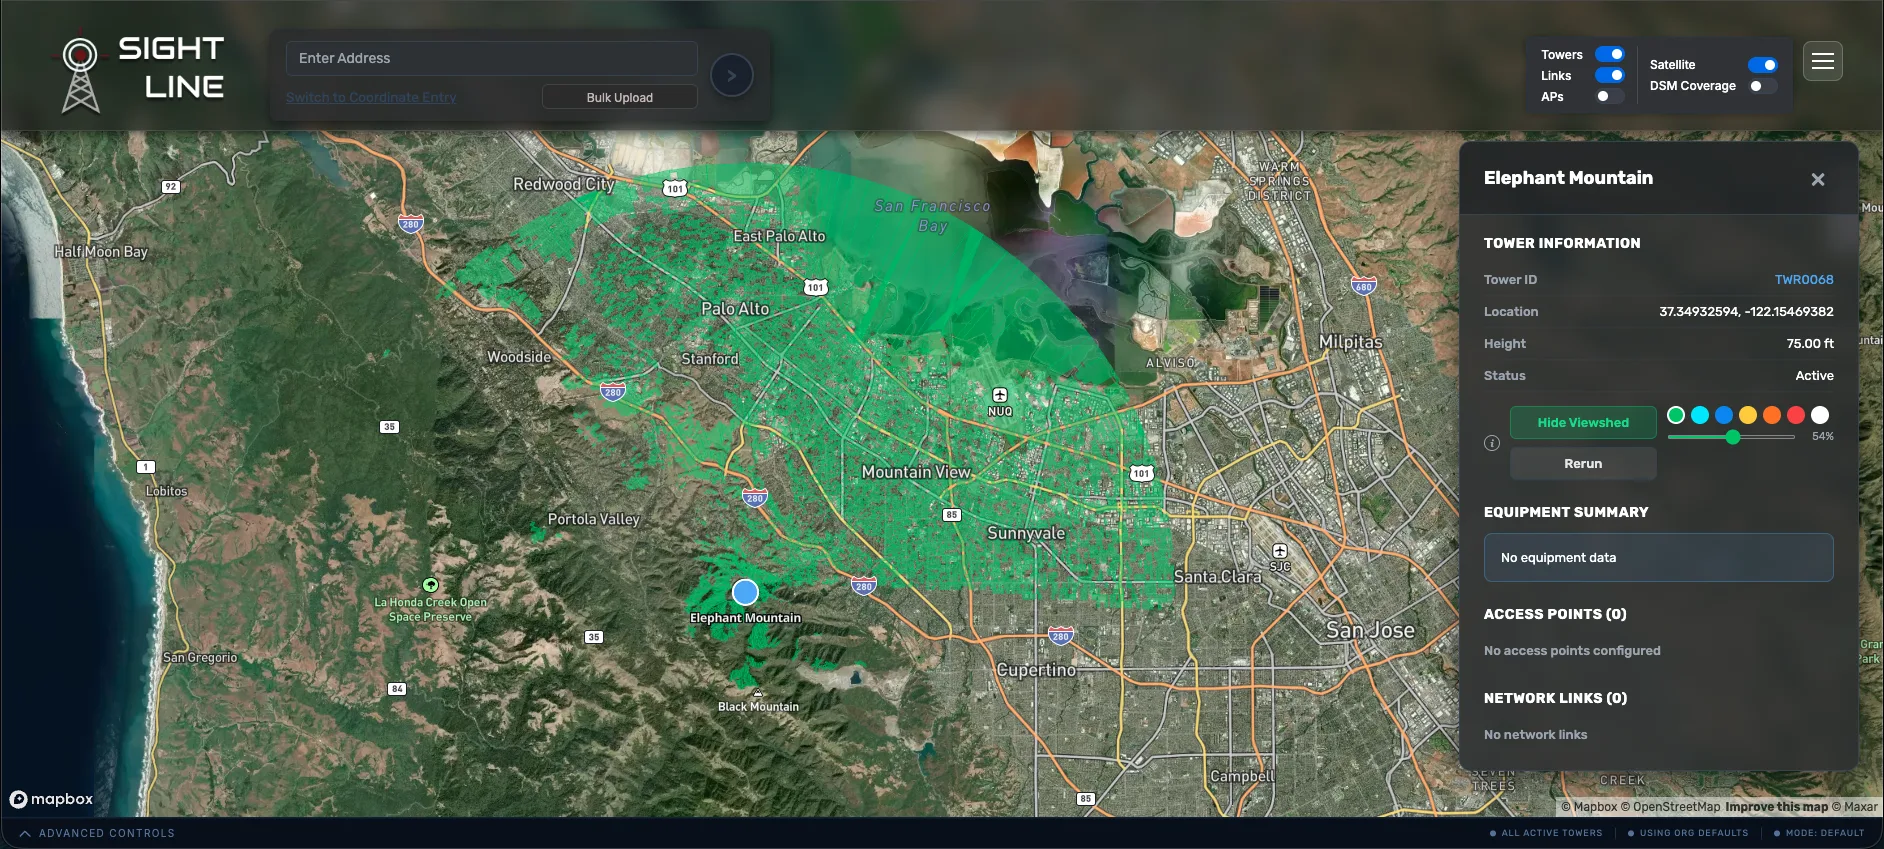
Before you place or evaluate a tower in detail, a viewshed gives you a quick visual read on what a tower can theoretically see across the surrounding surface. Run a viewshed check from a tower's detail view — SightLine generates a coverage overlay based on surface elevation (including buildings and trees, not just bare ground), independent of any specific customer address or access point sector.
Use this as a first-pass sanity check on a candidate tower site before diving into individual address checks. It is run at a slightly lower resolution than full assessments and thus should be treated as a guide rather than a replacement to full location assessments. Every viewshed is computed at a 10 mile radius from the tower.
Our Data
Elevation Data (USGS)
Line-of-sight analysis is only as good as the surface elevation data behind it. SightLine uses elevation data from the USGS 3D Elevation Program (3DEP) — high-resolution LiDAR-derived elevation models covering the United States.
- Where available, we use the most detailed dataset covering a given location, automatically.
- These are surface models, meaning they capture buildings, trees, and other structures — not just bare ground — which matters for realistic obstruction analysis.
For the full technical breakdown, see our data sources page.
Structure Data (NSI)
SightLine also references the National Structure Inventory (NSI), a dataset of building locations and attributes across the U.S. This is what powers Bulk Area Select — when you draw a shape on the map, SightLine looks up every real structure inside it from NSI instead of requiring you to supply your own location list.
Troubleshooting
Frequently Asked Questions
Why did I get "No DEM Data"?
Elevation data isn't available for that specific location. This is uncommon within the U.S. but can happen at the edge of covered regions. Try again — SightLine automatically falls back to a lower-priority dataset if one is available — and if it persists, let us know the location via Support so we can check coverage there.
Why did I get "Out of Range" for an address near my towers?
No towers were found within your organization's Assessment Distance of that address. Check your LOS Configuration default, or increase the distance for that specific run if you expect a farther tower to reach it.
Why is a result "Potentially Serviceable" instead of a clear yes?
The address falls within an access point's azimuth coverage, but the elevation/tilt fit isn't a confident match or line-of-sight is clear but no APs are covering. Line-of-sight may still work, but it's worth a closer look for realigning or adding APs. See How Results Are Prioritized for how this affects tower ranking.
Why don't I see the Bulk Upload option?
Bulk address checking (CSV and Bulk Area Select) is available on the SightLine Pro plan. See pricing, or ask your organization's Admin to upgrade.
I invited a teammate and they haven't gotten the email.
Check Settings → User Management — if they still show as a pending invite, have them check spam, or remove and re-invite them. Make sure they're logging in with the exact email address the invite was sent to. Contact support@sightlinetelecom.com if the issue persists.
Why is my exported speed estimate showing as blank?
That access point doesn't have Speed Bands configured for the customer's distance yet. Add bands for that AP and re-run the check.
More
Getting Help
Didn't find what you're looking for?
- Use the Support & Requests tab in Settings to reach our team directly from within the app.
- Or email support@sightlinetelecom.com for assistance.